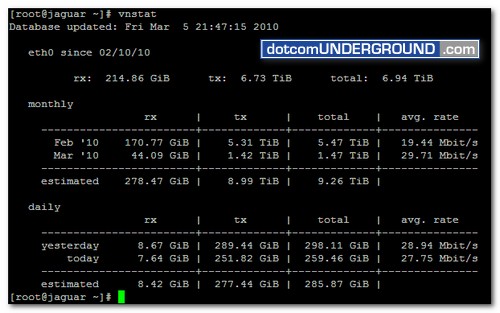
vnStat is a console-based network traffic monitor for Linux and BSD that keeps a log of network traffic for the selected interface(s). It uses the network interface statistics provided by the kernel as information source. This means that vnStat won’t actually be sniffing any traffic and also ensures light use of system resources.
You can download the latest version on vnStat here.
How to install vnStat:
wget http://humdi.net/vnstat/vnstat-1.10.tar.gz
(replace vnstat-1.10.tar.gz with the latest version number)
tar -zxvf vnstat-1.10.tar.gz
cd vnstat-1.10
make
make install
Create Database for vnStat:
Every interface that should be monitored needs to be introduced
to vnStat. For that you need to create a database for every interface you want to monitor.
Check for available interface names then run:
vnstat --iflist
and select a suitable looking interface from the provided list. Usually
‘lo’ isn’t the one you are looking for. For dedicated servers it should be eth0 and venet0 for VPS.
To create database for eth0:
/usr/bin/vnstat -u -i eth0
Replace ‘eth0‘ in the command with any available interface if needed.
Repeat that for every other interface you wish to use.
Set init Script for vnStat:
cp examples/init.d/redhat/vnstat /etc/init.d
chkconfig --add vnstat
chkconfig vnstat on
service vnstat start
vnStat should now be running on your system.
Using vnStat:
After installation, it take some time to generate bandwidth usage stats. So you need to wait few hours before you can check the stats. During the time, vnstat cronjob runs and collect data from your server to generate the report.
To see the bandwidth usage stat:
vnstat
vnstat -d
vnstat -m
Here is an sample vnstat report:

Tags: CenoOS, Linux, root, Unix
Categories: Tech, Tips and Tricks, Tutorials
